 Traffic Burstiness
 Traffic Burstiness
Another aspect of the communication behavior that a single traffic per instruction metric does not capture is burstiness. Consider the following code fragments:
    A () {                               B () {
        repeat 1M times {
            write 1 B;                       repeat 1M times {
        }                                        write 1 B;
        repeat 1M times {                        compute;
            compute;                         }
        }
    }                                    }
The burstiness issue illustrated here is related to the issues discussed above but different. It's not a granularity issue because in both programs we are doing small writes. It's not an asynchrony issue either because the writes can be asynchronous in both programs. Yet we expect the performance of these two programs to differ under certain circumstances.
Function A is attempting to inject all of its messages into the network at once. When the network is congested, A will be forced to wait. Function B, on the other hand, spreads its communication over a longer period of time and experiences less congestion.
So who wins? Interestingly enough, the answer depends on what metric we use. If we use peak bandwidth, A is likely to beat B. If we use traffic per instruction, it's a draw. And if we use average bandwidth or running time, B is likely to win!
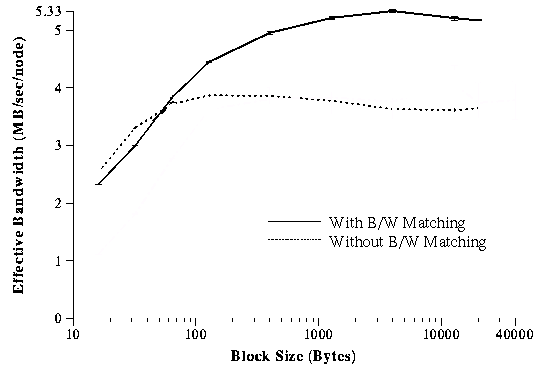
To further illustrate the idea, we consider the ``bandwidth matching'' technique by Brewer . In order not to overrun a slow receiver, the sender deliberately limits its injection rate. This is an example of an application's effort of smoothing burstiness to achieve better throughput. As shown in the following figure, the performance gain can be quite dramatic.

Again, we have seen that the simplistic Splash-2 analysis has failed to capture an application's communication behavior. Our proposed solution to this problem is similar to the one discussed in granularity page. We need to characterize the amount of communication between computations.